Making Good Things Happen
Graphic Recording is a Powerful Way to Capture Qualitative Data
As we are increasingly saturated with data, finding ways to visualize information can create shared understanding and move projects forward in a more effective manner than just words on a paper. Many people think about data visualization for numbers and other quantitative data. However, visualization can be valuable for qualitative data too. One visualization option for qualitative information is graphic recording.
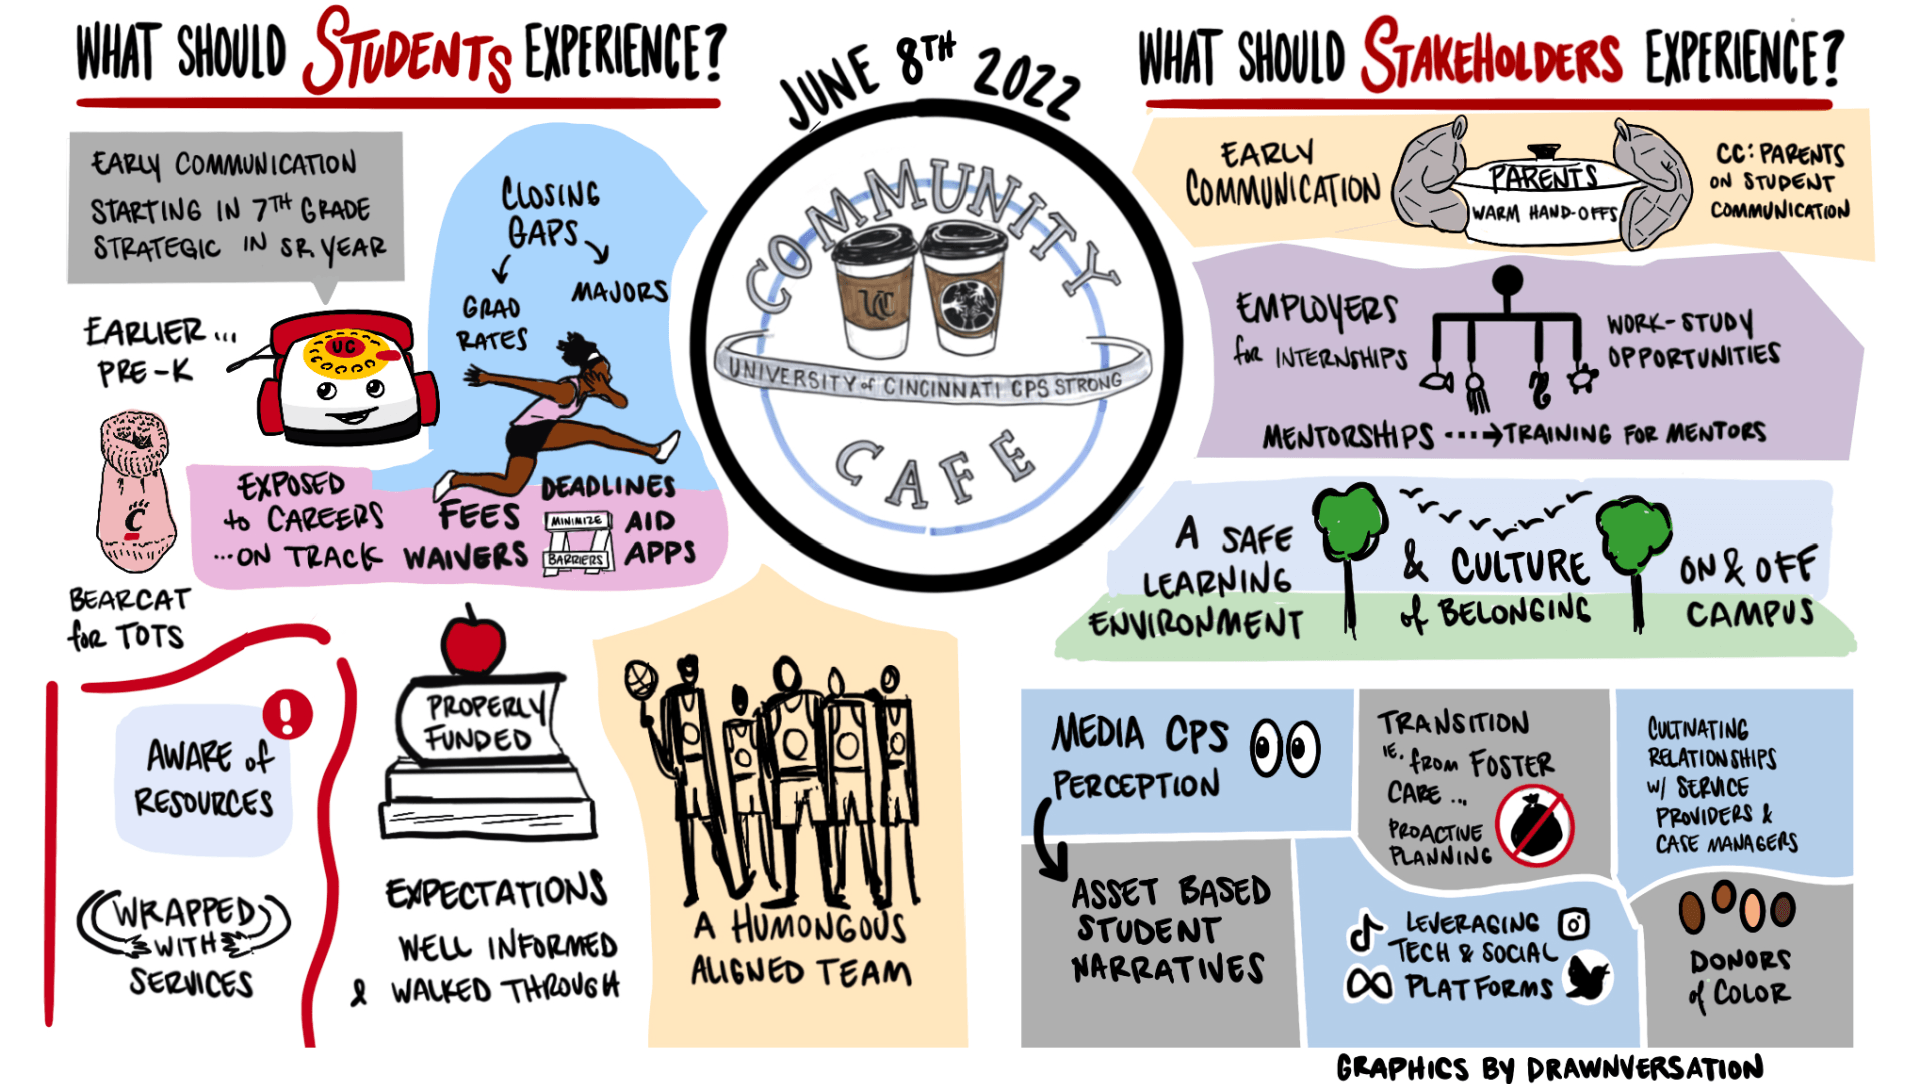
Graphic recording captures conversations and stories into images, often generated and displayed during a meeting. It is increasingly used in continuous improvement from strategic planning to community engagement to evaluation. Graphic recording is also occurring in conference presentations to increase audience engagement and to synthesize keynote speeches. Scale Strategic Solutions worked with Brandon Black of Drawnversation to record a series of community cafes for the University of Cincinnati’s CPS Strong initiative. We were able to use graphic recording for in virtual and in-person settings.
Here is what we love about working with graphic recording:
· Graphic recording can integrate and summarize parts of a discussion succinctly.
· Visual images of the conversation help everyone understand the points communicated by fellow participants.
· The visualization prompts other ideas from participants as they see the notes coming together.
· Stakeholders can quickly review the graphic notes after a meeting to comprehend what was said.
· As participants see their conversations depicted, graphic recordings generate emotion and excitement in ways that traditional meeting notes do not evoke.
A picture is worth a thousand words. How have you used graphic recording? What do you use to visualize themes from conversations or convenings?